Measuring Opportunity, One Neighborhood at a Time
The new Inclusive Growth Score helps identify opportunities for revitalization and evaluate the outcomes of investments in Opportunity Zones.
By: Arturo Franco and Aditya Rau
“Starfish are not saved one by one,” writes David Brooks in a New York Times column. He is referring to a young child’s earnest argument that saving even one beached starfish “matters to that one.” Unlike the young child, Brooks believes that transformative impact means abandoning models of change centered on the individual. Instead, he advocates for looking to the neighborhood as the essential unit of social change.
Indeed, this idea is at the heart of the Opportunity Zone incentive established by Congress in the Tax Cuts and Jobs Act of 2017. The incentive seeks to encourage long-term investment in low-income urban and rural communities across the United States. There are now 8,766 Opportunity Zones spanning all 50 states. They are home to more than 30 million Americans, one-third of them children, and they are most typically communities in dire need. Opportunity Zones collectively have a 29 percent poverty rate, nearly twice that of the U.S.
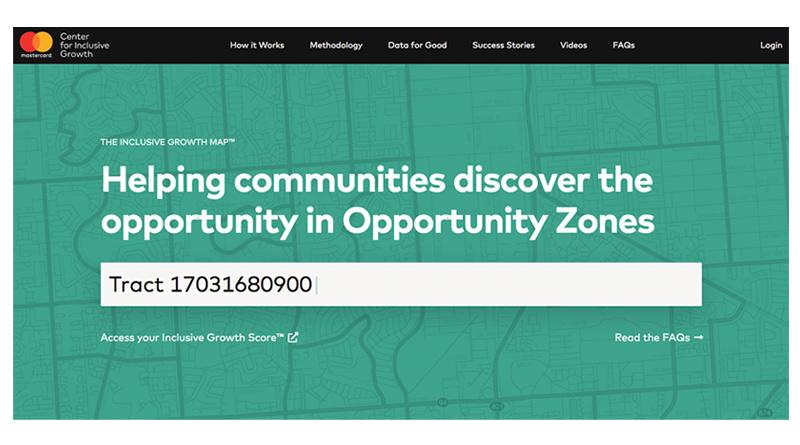
A New Tool to Track How Well Opportunity Zone Investments Are Performing
So, how can taxpayers, policymakers and local leaders understand if the Opportunity Zone incentive is benefiting their neighborhoods and working for their communities?
This is the question that inspired the design and launch of the Inclusive Growth Score™ a tool that allows users to benchmark and measure changes in levels of inclusion in Opportunity Zones. Each Opportunity Zone receives a score based on a combination of Mastercard, proprietary and open-source data. The score ranks a given Opportunity Zone relative to Opportunity Zones within the same county, city, state or across the entire country. The higher the score, the more likely it is that indicators of inclusive growth are trending in the right direction over time.
Drawing on the 18 metrics that power the Inclusive Growth Score™, early analysis provides a precise snapshot of growth, equity and access to essential services and resources within Opportunity Zones, as compared to the entire U.S.
Key insights include:
- Populations within Opportunity Zones are growing at half the average rate nationally.
- Residential values in Opportunity Zones have grown by only a third as much as the average residential value nationally in the last five years.
- Opportunity Zones have 10 to 15 percent less access to internet subscriptions, affordable housing and short commute times (35 minutes or less; the average commute time in the U.S. is 26 minutes).
- Female poverty rates are 20 percent higher in Opportunity Zones.
The Score has also unearthed new opportunities that can inform efforts to attract investments. For example, the tool shows a wide range of results where average spend growth or commercial diversity in some Opportunity Zones is multiple times greater than the average across all Opportunity Zones.
The distribution of data, and the complexity of the resulting insights will require local context and partnership to advance decision making. Indeed, the Inclusive Growth Score™ must be complemented by civic leadership at the neighborhood level. This is why we have partnered with organizations like Accelerator for America, the Governance Project and the Economic Innovation Group to spur action and advance community wealth. Accelerator for America’s Investment Prospectus tool, the Governance Project’s last-mile solutions and the Economic Innovation Group’s thought leadership all rely on data-driven approaches to help cities and communities think differently about inclusive growth.
“The next generation of place-based policymaking will require innovative tools to guide local strategy, measure impact and empower policymakers to be more responsive to a changing economic landscape,” said John Lettieri, president and CEO of the Economic Innovation Group.
The Center for Inclusive Growth is committed to using data science for social impact because better inputs can lead to better outcomes. A much needed current and quantitative approach to decision-making can help lift up communities everywhere. The Inclusive Growth Score™ is the Center’s contribution to that ongoing effort.